
⚛️ Electron Transition Diagram: Understanding Energy Levels in Atoms
Electron transition diagrams are visual representations that show how electrons move between different energy levels, or shells, within an atom. These transitions are a fundamental concept in atomic physics and quantum mechanics because they explain how atoms absorb and emit energy in the form of light. The diagram above illustrates an electron moving from a higher energy level to a lower one while releasing energy.
🔬 What Are Electron Energy Levels?
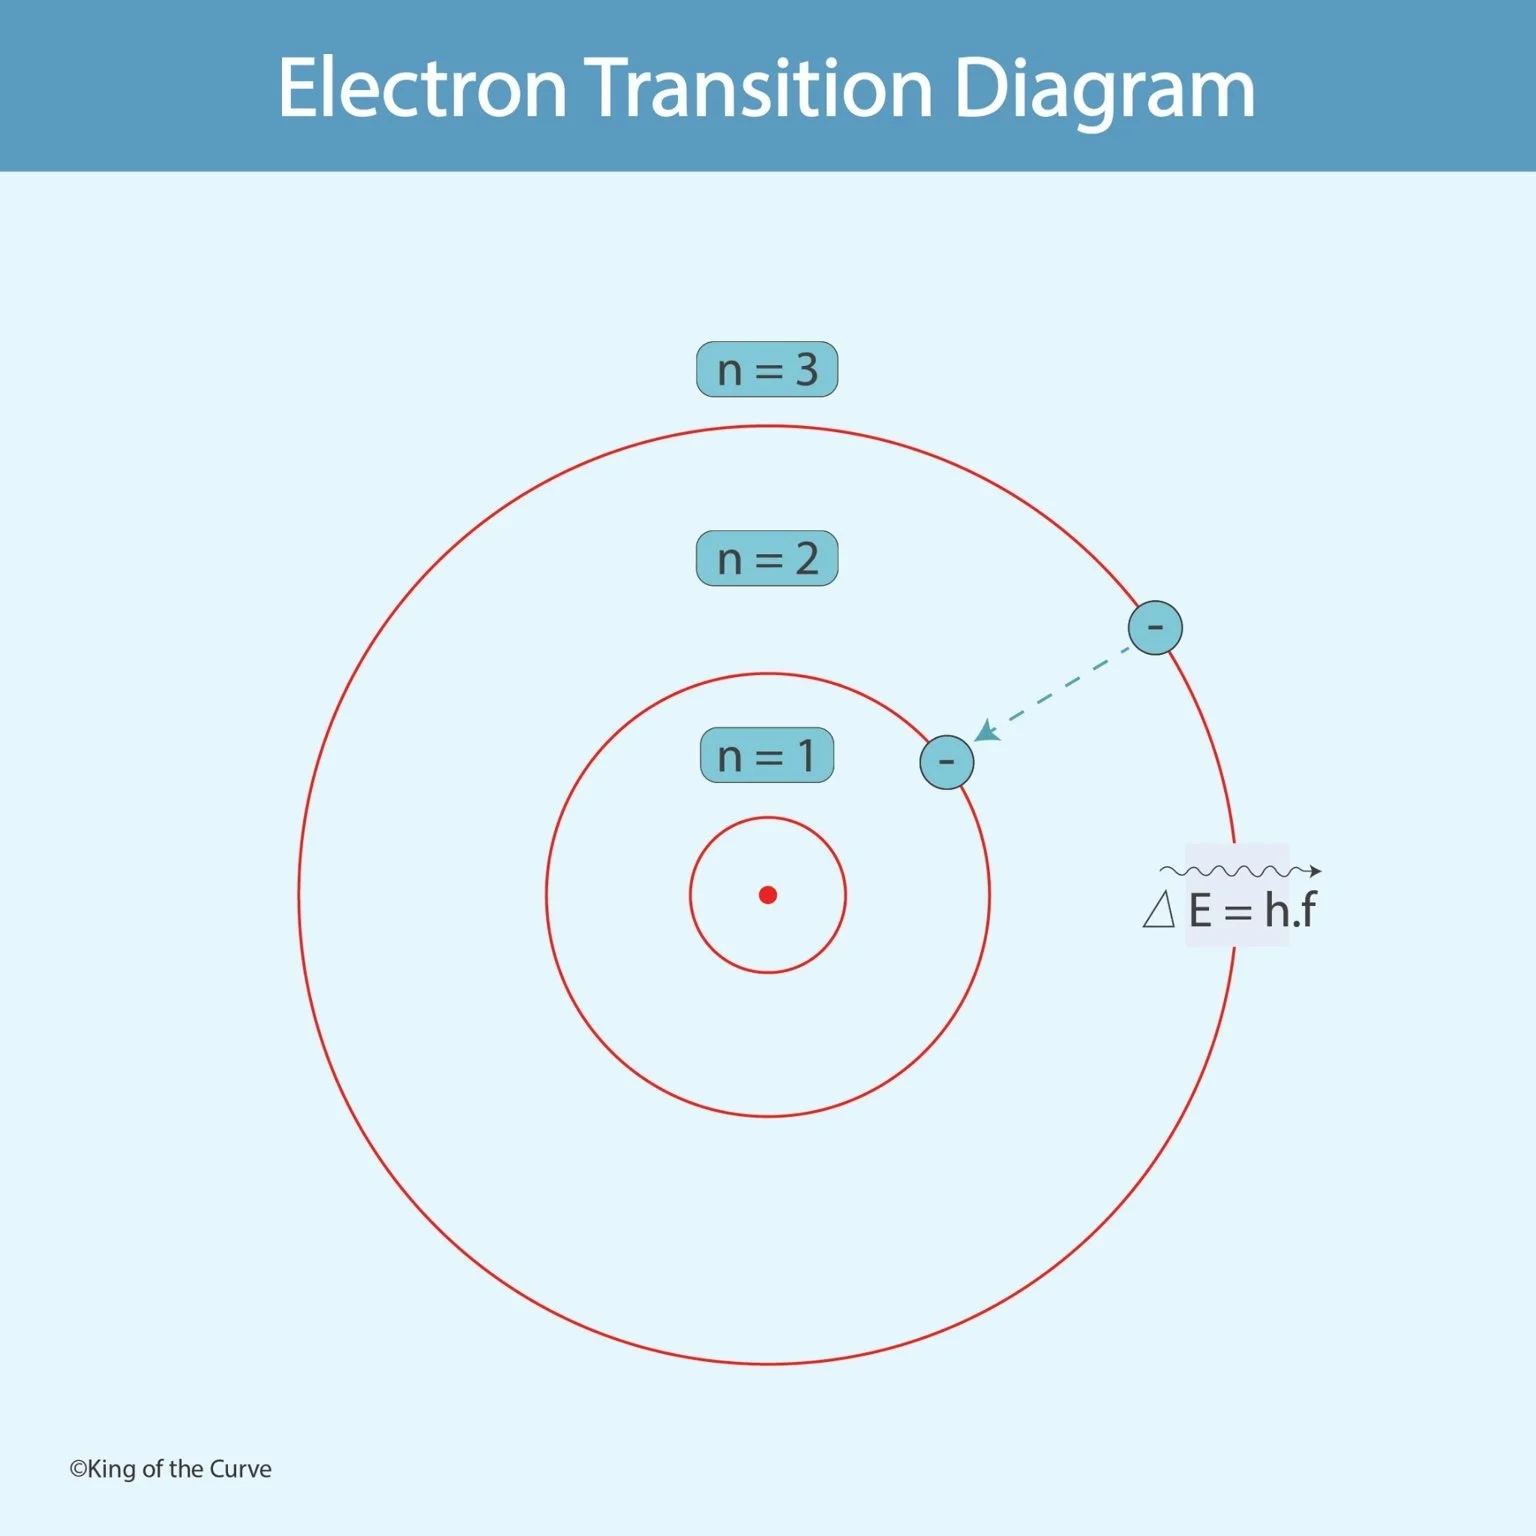
Electrons in an atom occupy specific energy levels around the nucleus, commonly labeled using the principal quantum number n. In the diagram:
n = 1 represents the first energy level closest to the nucleus
n = 2 is the second energy level
n = 3 is the third energy level
The farther the electron is from the nucleus, the higher its energy. Electrons cannot exist between these levels; they can only occupy fixed energy states.
⚡ What Is an Electron Transition?
An electron transition occurs when an electron moves from one energy level to another.
📉 Transition to a Lower Energy Level
In the diagram, the electron moves from n = 3 to n = 2. During this process:
The electron loses energy
The excess energy is emitted as electromagnetic radiation
This emitted energy is represented by the equation:
ΔE=h⋅f
Where:
ΔE = change in energy
h = Planck’s constant
f = frequency of emitted light
This is the principle behind atomic emission spectra.
🌈 Why Does Light Get Emitted?
When electrons drop to lower energy states, the atom becomes more stable. The lost energy cannot disappear, so it is released as a photon of light. Different transitions produce different wavelengths and colors of light.
For example:
Large energy drops produce high-frequency light
Small energy drops produce lower-frequency light
This explains why elements produce unique spectral lines.
🧪 Absorption vs Emission
Electron transitions can occur in two directions:
| Process | Electron Movement | Energy Change |
|---|---|---|
| Absorption | Lower → Higher level | Energy absorbed |
| Emission | Higher → Lower level | Energy released |
The diagram shown represents an emission transition because the electron moves inward toward the nucleus.
📚 Importance of Electron Transition Diagrams
Electron transition diagrams are important in many scientific fields because they help explain:
Atomic spectra
Laser technology
Fluorescence
Chemical behavior of atoms
Quantum mechanics principles
Astronomy and stellar analysis
Scientists use these transitions to identify elements in stars and gases through spectroscopy.
🔭 Relationship Between Energy and Frequency
The emitted energy depends directly on the frequency of radiation:
ΔE=hf
Higher frequency light corresponds to greater energy changes. Ultraviolet light, for instance, has much more energy than infrared light because of its higher frequency.
🧠 Key Takeaway
Electron transition diagrams help visualize how electrons move between fixed energy levels within atoms. When electrons transition from higher levels to lower levels, they release energy as light. These transitions form the basis of atomic spectra and many modern technologies, making them one of the most important concepts in chemistry and physics.

Frequently Asked Questions (FAQs)
-
Aim for 4-6 focused hours, ensuring you incorporate breaks to avoid burnout.
-
Practice mindfulness techniques, take practice exams under realistic conditions, and maintain a balanced lifestyle.
-
Set short-term goals, seek support from mentors, and reward yourself for small achievements.
-
Regular exercise improves focus, reduces stress, and enhances overall mental clarity.
-
KOTC offers personalized learning tools, gamification features, and adaptive question banks to help students stay on track without burnout.