
📊 Distance vs Time Graph: Understanding Motion Made Simple
A distance vs time graph is one of the most important tools in physics for understanding motion. It visually represents how an object’s position changes over time, helping us analyze speed, acceleration, stops, and direction of movement.
🚀 What Does a Distance-Time Graph Show?
X-axis (horizontal): Time (seconds)
Y-axis (vertical): Distance (meters)
👉 The slope (steepness) of the line tells us the speed:
Steeper line = Faster speed
Straight line = Constant speed
Curved line = Changing speed (acceleration/deceleration)
Flat line = Object is stopped
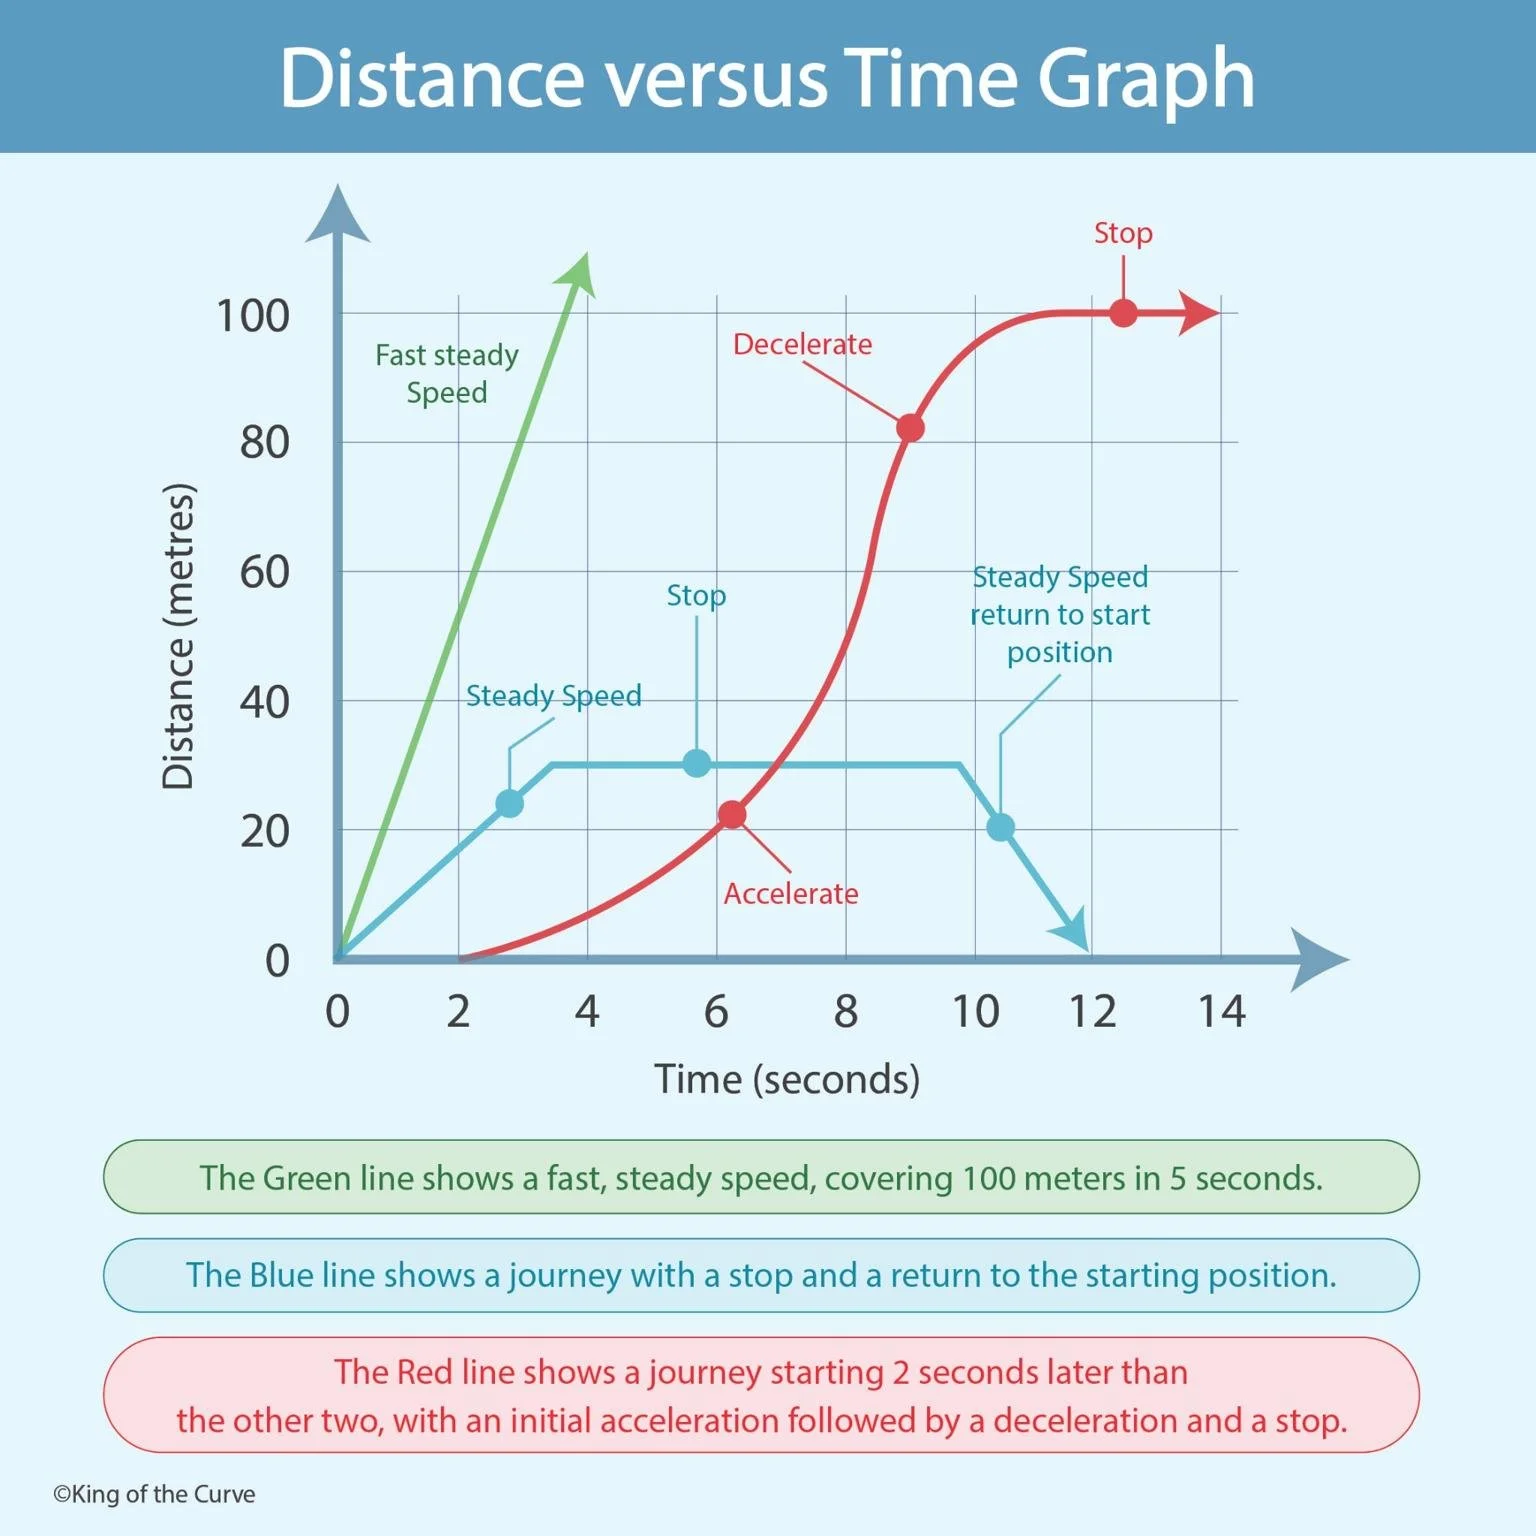
🟢 Green Line: Fast, Steady Speed
The green line represents an object moving at a constant high speed.
It is a straight, steep line
Covers 100 meters in 5 seconds
Indicates uniform motion (no acceleration)
👉 Key takeaway: The object moves quickly without changing speed.
🔵 Blue Line: Stop and Return Journey
The blue line shows a more complex journey:
Initial steady movement (straight upward slope)
Flat section → object stops
Downward slope → returning to start position
👉 Key takeaway:
Flat line = no movement (speed = 0)
Downward slope = moving back toward origin
This type of graph is useful for understanding real-life motion with pauses and direction changes.
🔴 Red Line: Acceleration and Deceleration
The red line represents motion with changing speed:
Starts later than the others (after 2 seconds)
Initially curves upward → acceleration
Then curves less steeply → deceleration
Finally becomes flat → stop
👉 Key takeaway:
Curved line = speed is not constant
Shape of curve shows how speed changes over time
⚡ Key Concepts to Remember
Speed = slope of the graph
Straight line = constant speed
Curved line = acceleration or deceleration
Horizontal line = object at rest
Downward slope = returning toward starting point
🧠 Real-Life Applications
Distance-time graphs are used in:
🚗 Vehicle motion analysis
🏃 Sports performance tracking
🚆 Train scheduling systems
🛰️ Physics and engineering simulations
They help simplify complex motion into easy-to-understand visuals.
🏁 Final Thoughts
Understanding distance vs time graphs is essential for mastering basic physics. By analyzing the slope and shape of the graph, you can quickly determine how an object is moving—whether it’s speeding up, slowing down, stopping, or reversing direction.

Frequently Asked Questions (FAQs)
-
Aim for 4-6 focused hours, ensuring you incorporate breaks to avoid burnout.
-
Practice mindfulness techniques, take practice exams under realistic conditions, and maintain a balanced lifestyle.
-
Set short-term goals, seek support from mentors, and reward yourself for small achievements.
-
Regular exercise improves focus, reduces stress, and enhances overall mental clarity.
-
KOTC offers personalized learning tools, gamification features, and adaptive question banks to help students stay on track without burnout.