
🔬 IR Spectroscopy: A Quick Guide to Functional Group Identification
Infrared (IR) spectroscopy is one of the most important analytical techniques in organic chemistry. It helps chemists identify functional groups within a molecule by measuring how chemical bonds absorb infrared radiation. Because different bonds vibrate at characteristic frequencies, an IR spectrum serves as a molecular fingerprint that reveals key structural information.
🌟 What Is IR Spectroscopy?
Infrared spectroscopy is a technique that analyzes how molecules absorb infrared light. When infrared radiation passes through a sample, certain wavelengths are absorbed by molecular bonds, causing them to vibrate.
These vibrations include:
Stretching vibrations
Bending vibrations
Twisting and rocking motions
The resulting absorption pattern creates an IR spectrum that can be used to identify specific functional groups within a compound.
🧪 Why Is IR Spectroscopy Important?
IR spectroscopy provides valuable information about molecular structure without destroying the sample.
Key Applications
Identifying functional groups
Confirming the identity of compounds
Monitoring chemical reactions
Detecting impurities
Characterizing unknown substances
Because of its speed and simplicity, IR spectroscopy is widely used in academic, industrial, pharmaceutical, and forensic laboratories.
📈 Using IR Spectroscopy to Monitor Reactions
One of the most practical applications of IR spectroscopy is following the progress of a chemical reaction.
As reactants are converted into products:
Peaks corresponding to reactant functional groups decrease.
New peaks associated with product functional groups appear.
Changes in peak intensity indicate reaction completion.
For example, during the oxidation of an alcohol to a ketone:
The O–H peak disappears.
The carbonyl (C=O) peak appears.
This allows chemists to determine whether a reaction has reached completion.
🧠 Important IR Peaks to Memorize
Certain absorption bands appear frequently in organic chemistry and are often emphasized in coursework.
💧 O–H Stretch
Location: Approximately 3200–3600 cm⁻¹
Characteristics:
Broad and strong peak
Common in alcohols and carboxylic acids
Often appears as a wide rounded absorption
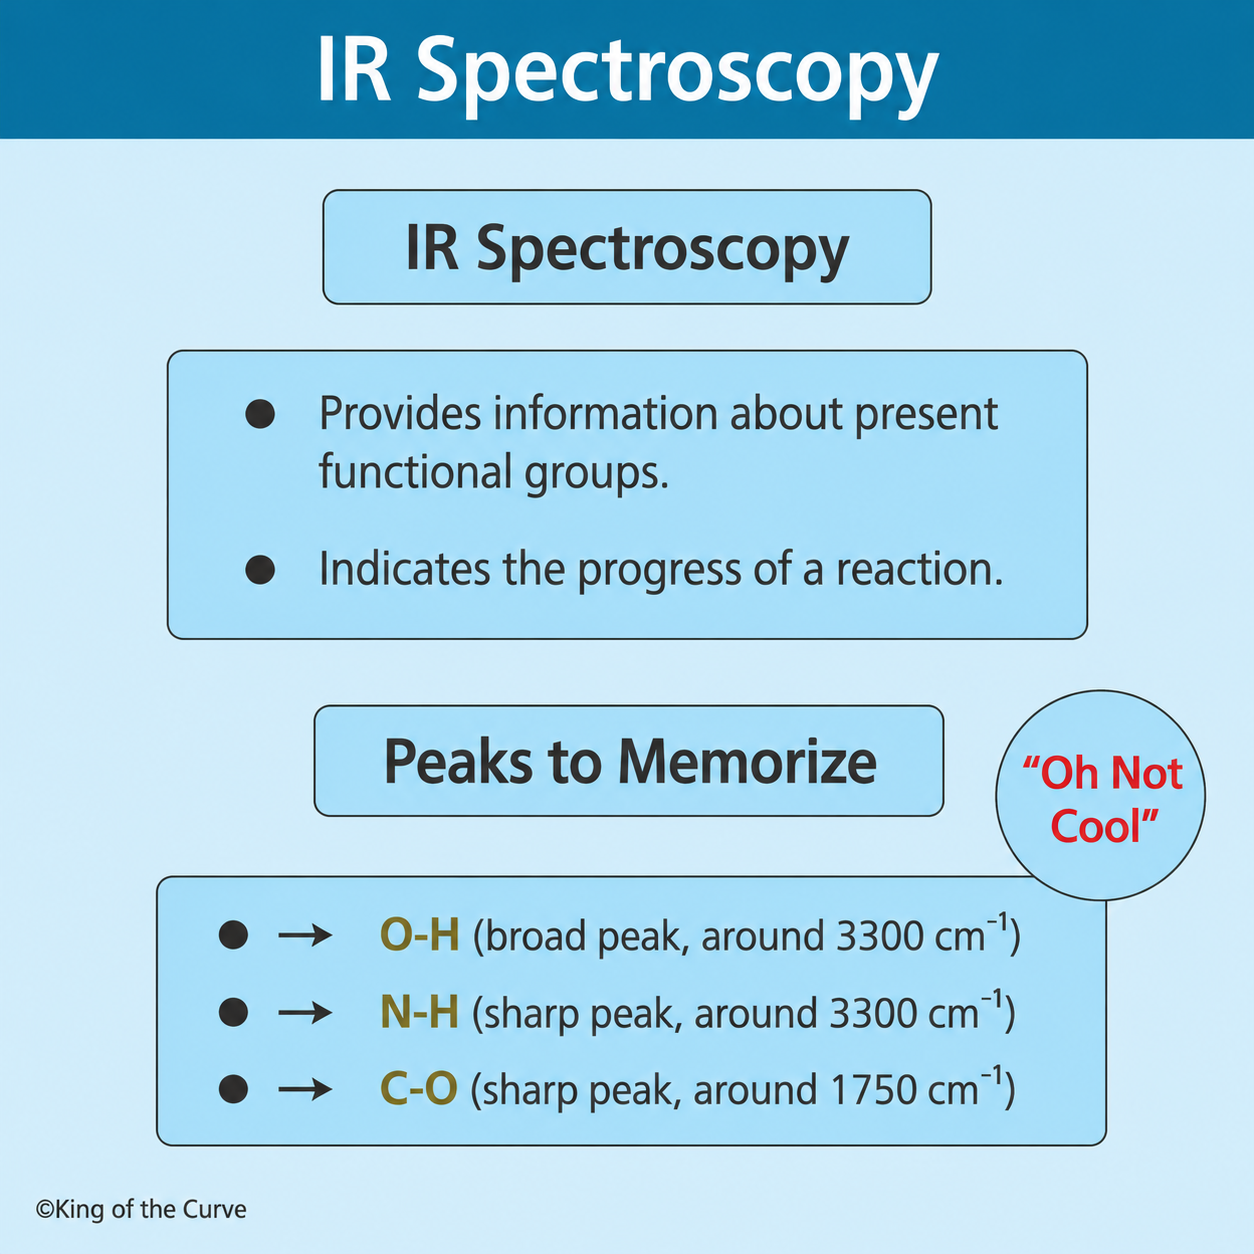
The diagram simplifies this as a broad peak around 3300 cm⁻¹, making it easy to remember.
🧬 N–H Stretch
Location: Approximately 3300–3500 cm⁻¹
Characteristics:
Sharp peak
Found in amines and amides
Usually narrower than an O–H absorption
Because N–H and O–H peaks occur in a similar region, the broadness of the O–H peak helps distinguish between them.
⚠️ Carbonyl (C=O) Stretch
Location: Approximately 1650–1750 cm⁻¹
Characteristics:
Very strong and sharp peak
One of the most diagnostic signals in IR spectroscopy
Present in aldehydes, ketones, esters, carboxylic acids, and amides
A carbonyl absorption near 1700–1750 cm⁻¹ is often the first feature chemists look for when interpreting an IR spectrum.
Note: The diagram labels this peak as C–O around 1750 cm⁻¹, but the characteristic peak near 1750 cm⁻¹ is actually C=O (carbonyl). A simple C–O single bond typically appears between 1000–1300 cm⁻¹.
🎯 The Memory Trick: “Oh Not Cool”
The diagram includes the mnemonic:
“Oh Not Cool”
This helps students remember:
| Mnemonic | Functional Group | Approximate Wavenumber |
|---|---|---|
| Oh | O-H | ~3300 cm-1 |
| Not | N-H | ~3300 cm-1 |
| Cool | C=O | ~1750 cm-1 |
This simple phrase can be useful when learning the most commonly tested IR absorptions.
🔍 How to Interpret an IR Spectrum
When analyzing an unknown spectrum:
Step 1: Look for Broad Peaks
A broad absorption near 3300 cm⁻¹ often indicates an O–H group.
Step 2: Check for Sharp Peaks Near 3300 cm⁻¹
A narrow peak may suggest an N–H bond.
Step 3: Search for a Strong Carbonyl Peak
A sharp absorption around 1700–1750 cm⁻¹ usually indicates a carbonyl-containing compound.
Step 4: Combine Evidence
Use all observed peaks together rather than relying on a single absorption band.
⚕️ Advantages of IR Spectroscopy
IR spectroscopy offers several benefits:
Fast analysis
Minimal sample preparation
Non-destructive testing
High sensitivity to functional groups
Useful for reaction monitoring
These advantages make it one of the most widely used techniques in chemical analysis.
📋 Key Takeaways
IR spectroscopy identifies functional groups by measuring bond vibrations.
Different bonds absorb infrared radiation at characteristic frequencies.
O–H groups produce broad peaks near 3300 cm⁻¹.
N–H groups produce sharp peaks near 3300 cm⁻¹.
Carbonyl (C=O) groups produce strong peaks around 1700–1750 cm⁻¹.
IR spectroscopy is valuable for identifying compounds and monitoring reaction progress.
The mnemonic “Oh Not Cool” helps remember O–H, N–H, and C=O absorptions.

Frequently Asked Questions (FAQs)
-
Aim for 4-6 focused hours, ensuring you incorporate breaks to avoid burnout.
-
Practice mindfulness techniques, take practice exams under realistic conditions, and maintain a balanced lifestyle.
-
Set short-term goals, seek support from mentors, and reward yourself for small achievements.
-
Regular exercise improves focus, reduces stress, and enhances overall mental clarity.
-
KOTC offers personalized learning tools, gamification features, and adaptive question banks to help students stay on track without burnout.