
🩺 Glucose Titration Curve in the Kidney
The glucose titration curve is a fundamental concept in renal physiology that explains how the kidneys filter, reabsorb, and excrete glucose as plasma glucose levels rise. Understanding this curve is essential for medical, nursing, and allied health students because it illustrates why glucose appears in urine during conditions such as diabetes mellitus.
📊 What Is the Glucose Titration Curve?
The glucose titration curve shows the relationship between:
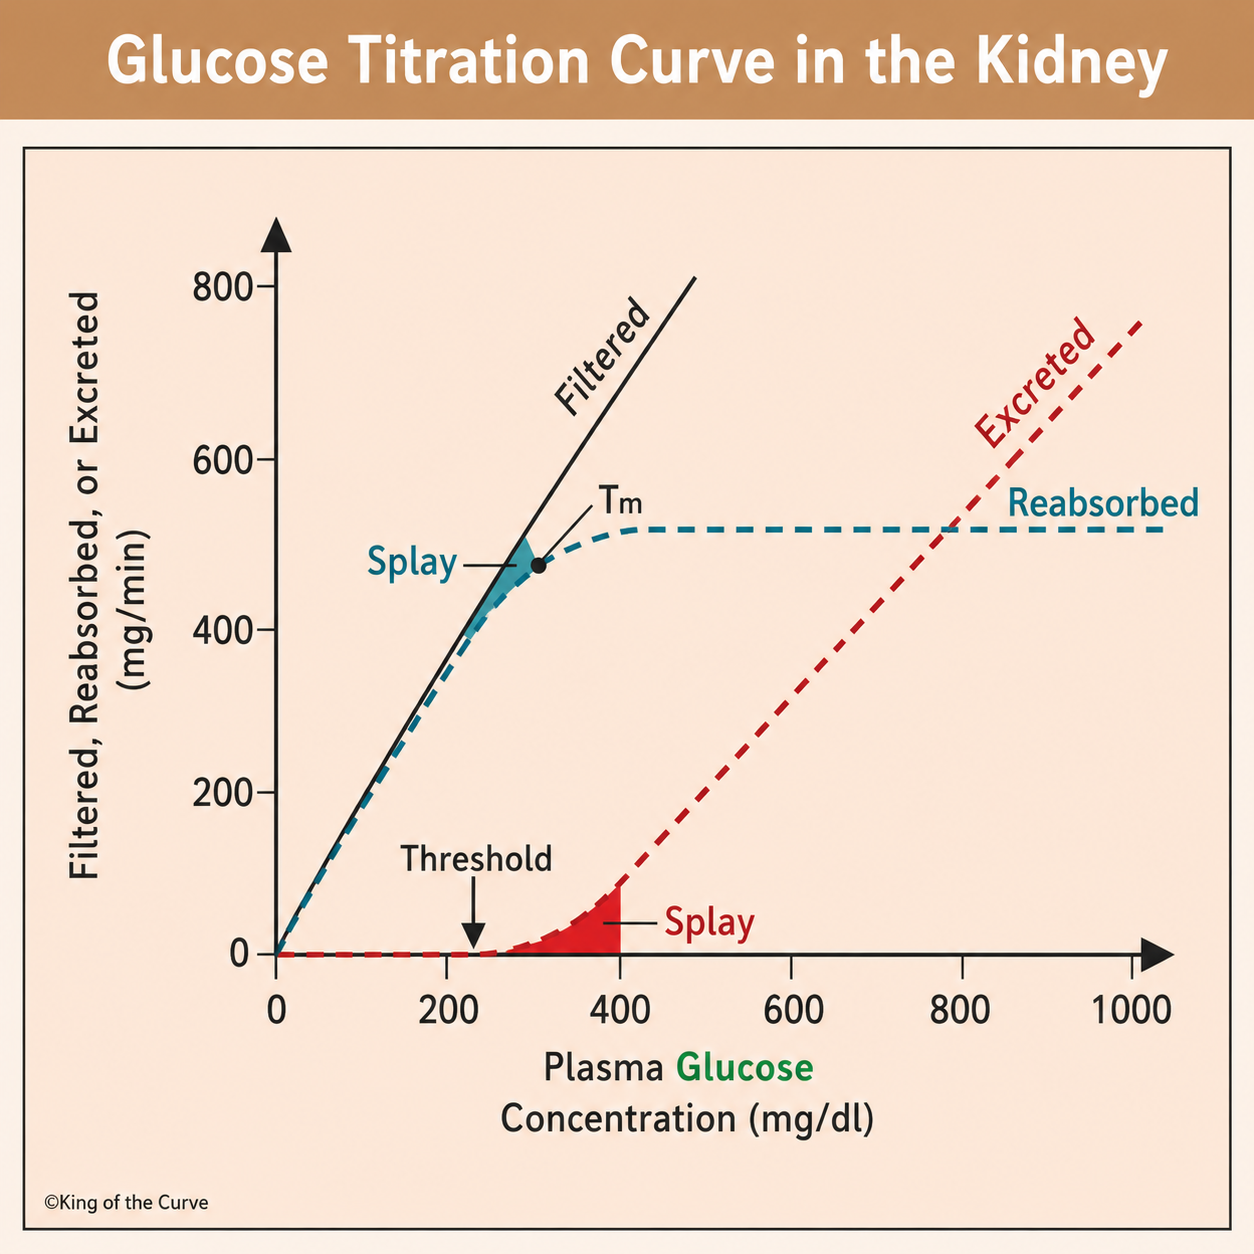
Plasma glucose concentration (x-axis)
Amount of glucose filtered, reabsorbed, or excreted (y-axis)
As blood glucose levels increase, the kidneys initially reabsorb all filtered glucose. However, once the renal transport system becomes saturated, glucose begins to appear in the urine.
🧠 How the Kidney Normally Handles Glucose
Glucose is freely filtered at the glomerulus and enters the renal tubules.
Key Processes:
Filtration
Glucose enters the nephron through glomerular filtration.
Filtered glucose increases proportionally with plasma glucose concentration.
Reabsorption
Glucose is reabsorbed in the proximal convoluted tubule.
Sodium-glucose transporters (SGLTs) move glucose back into the bloodstream.
Excretion
Under normal conditions, no glucose is excreted.
Excretion begins only when reabsorptive capacity is exceeded.
📈 The Filtered Load Curve
The filtered glucose curve is represented by the straight black line.
Characteristics
Increases linearly with plasma glucose concentration.
The higher the plasma glucose, the greater the filtered load.
There is no saturation of filtration itself.
Formula:
Filtered Load = GFR × Plasma Glucose Concentration
🔄 The Reabsorbed Curve
The reabsorbed glucose curve initially follows the filtered curve.
Characteristics
Nearly all filtered glucose is reabsorbed at low plasma concentrations.
Eventually reaches a plateau.
Plateau occurs when all glucose transporters become saturated.
This maximum reabsorptive capacity is known as the Transport Maximum (Tm).
🚦 What Is Transport Maximum (Tm)?
Definition
Transport Maximum (Tm) is the highest rate at which the renal tubules can reabsorb glucose.
Important Points
Determined by the number of glucose transporters available.
Once Tm is reached, additional glucose cannot be reabsorbed.
Excess glucose remains in the tubular fluid and is excreted.
Typical Value
For glucose:
Tm ≈ 375 mg/min
(Exact values vary among references.)
⚠️ What Is the Renal Threshold?
The renal threshold is the plasma glucose concentration at which glucose first begins to appear in the urine.
Typical Threshold
≈ 180 − 200 mg/dL
At this point:
Some nephrons begin reaching saturation.
Small amounts of glucose start appearing in urine.
🌊 Understanding Splay
One of the most important features of the graph is the splay region.
Definition
Splay is the curved region between:
The renal threshold
The transport maximum (Tm)
Why Does Splay Occur?
Not all nephrons are identical.
Different nephrons:
Have slightly different transport capacities.
Reach saturation at different glucose concentrations.
As a result:
Glucose begins appearing gradually in urine.
Excretion increases progressively rather than abruptly.
📉 The Excretion Curve
The red dashed line represents glucose excretion.
Characteristics
Remains at zero below the renal threshold.
Begins rising during the splay region.
Increases linearly once Tm is exceeded.
The amount excreted equals:
Excreted Glucose = Filtered Load − Reabsorbed Glucose
🩺 Clinical Significance
Diabetes Mellitus
In uncontrolled diabetes:
Plasma glucose rises significantly.
Filtered glucose exceeds Tm.
Excess glucose spills into urine (glucosuria).
Common consequences include:
Osmotic diuresis
Polyuria
Dehydration
Increased thirst (polydipsia)
Pregnancy
Pregnant individuals may develop glucosuria even with normal blood glucose levels due to:
Increased GFR
Altered tubular handling of glucose
SGLT2 Inhibitors
Medications such as:
Empagliflozin
Dapagliflozin
Canagliflozin
Work by:
Blocking glucose reabsorption
Increasing urinary glucose excretion
Lowering blood glucose levels
📚 Key Terms to Remember
| Term | Definition |
|---|---|
| Filtered Load | Amount of glucose filtered by the glomerulus |
| Renal Threshold | Plasma glucose level where glucose first appears in urine |
| Transport Maximum (Tm) | Maximum glucose reabsorption rate |
| Splay | Gradual saturation region between threshold and Tm |
| Glucosuria | Presence of glucose in urine |
| SGLT | Sodium-glucose transporter responsible for glucose reabsorption |
✅ Final Takeaway
The glucose titration curve demonstrates how the kidneys efficiently conserve glucose under normal conditions while revealing the limits of tubular reabsorption. The concepts of renal threshold, transport maximum (Tm), and splay explain why glucose begins appearing in urine when plasma glucose levels become elevated, making this graph highly relevant to understanding diabetes mellitus and renal physiology.

Frequently Asked Questions (FAQs)
-
Aim for 4-6 focused hours, ensuring you incorporate breaks to avoid burnout.
-
Practice mindfulness techniques, take practice exams under realistic conditions, and maintain a balanced lifestyle.
-
Set short-term goals, seek support from mentors, and reward yourself for small achievements.
-
Regular exercise improves focus, reduces stress, and enhances overall mental clarity.
-
KOTC offers personalized learning tools, gamification features, and adaptive question banks to help students stay on track without burnout.