🌍 Overview: What is the Demographic Transition Model?
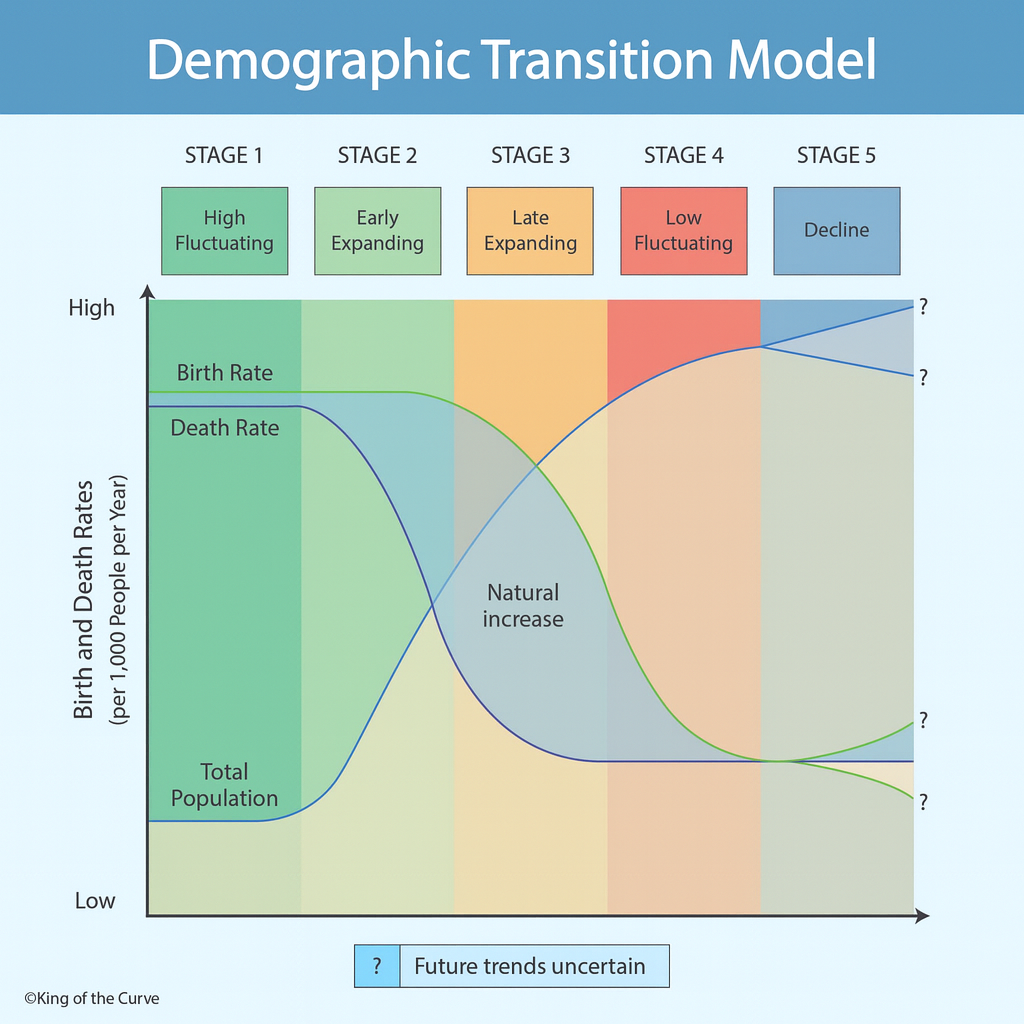
The DTM tracks how birth rate, death rate, and total population change as countries industrialize. It moves through five stages—from high fluctuation to potential decline—driven by sanitation, medicine, education, urbanization, and economics.
🧪 Stage 1 — High Fluctuating
Birth rate: High; Death rate: High → Little growth
Pre-industrial: famine, disease, war. Large families for labor and survival.
🚀 Stage 2 — Early Expanding
Birth rate: Stays high; Death rate: Drops fast → Population boom
Public health, vaccines, sanitation, and food security improve survival.
🏙️ Stage 3 — Late Expanding
Birth rate: Falls; Death rate: Low → Growth slows
Urbanization, female education, contraception, and child-costs reduce family size.
🧓 Stage 4 — Low Fluctuating
Birth rate: Low; Death rate: Low → Stable/slow growth
High income, dual-earner households, delayed marriage, aging population.
📉 Stage 5 — Decline (Possible)
Birth rate: Below replacement; Death rate: Low–moderate → Negative growth
Workforce shrinkage and dependency ratio rise; migration policy becomes pivotal.
📊 Quick Comparison Table
| Stage | Birth Rate | Death Rate | Population Growth | Typical Drivers |
|---|---|---|---|---|
| 1 | High | High | Minimal | Pre-industrial, poor sanitation/healthcare |
| 2 | High | Rapid fall | Very high | Public health, nutrition, vaccines |
| 3 | Falling | Low | Slowing | Urbanization, education, contraception |
| 4 | Low | Low | Stable/slow | High income, aging, gender equity |
| 5 | Very low | Low–moderate | Negative | Sub-replacement fertility, aging |
🎯 Exam Tip (MCAT/SocSci/Geo)
Natural increase = Birth rate − Death rate (ignore migration).
Recognize graph shapes: Stage 2 shows a wide gap (birth ≫ death); Stage 3 gap narrows; Stage 4 lines converge; Stage 5 birth dips below death.
📢 Call to Action
Want crisp visuals + spaced-repetition for soc/psych graphs like the DTM? Explore KOTC’s adaptive Q-bank and concept images. See more diagrams at mcat.kingofthecurve.org and grab practice at kingofthecurve.org/qotd.

Frequently Asked Questions (FAQs)
-
Aim for 4-6 focused hours, ensuring you incorporate breaks to avoid burnout.
-
Practice mindfulness techniques, take practice exams under realistic conditions, and maintain a balanced lifestyle.
-
Set short-term goals, seek support from mentors, and reward yourself for small achievements.
-
Regular exercise improves focus, reduces stress, and enhances overall mental clarity.
-
KOTC offers personalized learning tools, gamification features, and adaptive question banks to help students stay on track without burnout.